Viewing Response Data in Preview Tool
At any point while running in either CAPI or ACASI Preview mode, you may view all current data by selecting Preview|Response Values (CAPI only) or pressing Ctrl+R (CAPI or ACASI). This will open the Response Values box displaying all Data Elements and Automatic Variables, starting with the first Data Element in the survey (i.e., not limited to current selection) through the most recent response collected in the active Preview session. Variables preceding the highlighted section of the survey contain the test value assigned in the Design Studio on the Data Element Test tab. You may also do a search for a specific variable name or question number from the Find what: box.
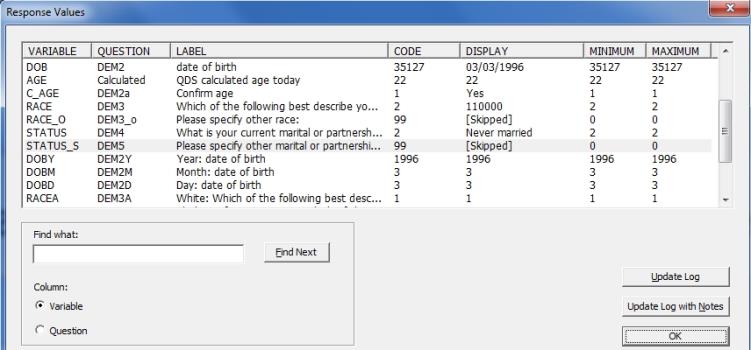
Response Values Columns
The following fields are included in the Response Values list box:
- Variable name
- Question number
- Variable label
- Numeric code
- Display value
- Minimum value for range of response
- Maximum value for range of response
Variables are displayed in the same order as that used when viewing variables in the Warehouse Manager (i.e., any component![]() A component variable is one part of a composite variable. Check Each, ranking, date, time, and time span response types all have composite and component variables. A Check Each component represents whether or not a response was selected. A ranking component represents the rank selected. A date, time, or time span component represents that part of the whole date or time, such as year, month, weeks, hour or minute. variables are at the end of the listing, such as DOBY, DOBM, and DOBD in the below image). When the Response Values box first opens, the variable associated with the last question answered is highlighted.
A component variable is one part of a composite variable. Check Each, ranking, date, time, and time span response types all have composite and component variables. A Check Each component represents whether or not a response was selected. A ranking component represents the rank selected. A date, time, or time span component represents that part of the whole date or time, such as year, month, weeks, hour or minute. variables are at the end of the listing, such as DOBY, DOBM, and DOBD in the below image). When the Response Values box first opens, the variable associated with the last question answered is highlighted.
Response data is continually updated during the Preview session; if you use the Previous Question button to go back and change responses, the next time Response Values are opened, they will be updated to reflect updated data values.
Tip: For Automatic Variables that are skipped or not yet encountered, the variable, question, and label information is displayed; however, all other columns are blank.
Sort and Find Options
Display order can be sorted by clicking on any column header; the sort order will vary depending on which column is clicked. Sorting by Variable, Question, Label, and Display columns sorts alphabetically; sorting by Code, Minimum, and Maximum columns sorts numerically. The first time clicking on a column header, rows are sorted in ascending order; clicking on a column a second time results in the rows being sorted in descending order.
You can search for a variable or question number (complete or partial) by selecting either the Variable or Question radio button to select the column, typing your search text in the Find what: box, and then selecting the Find Next button or F3. When QDS finds a matching variable or question number, the first matching item is highlighted in the list box and scrolled into view; select Find Next or F3 to search for the next instance.
Clicking OK will return you to Preview mode if the end of the section has not yet been reached; it will return you to the Design Studio file if the response data were opened at the end of the highlighted section.
Update Log
If the Produce preview session log option is checked on the Preview options Log tab, the Update Log and Update Log with Notes buttons are enabled and you will be able to update the current log or update the log and add notes. See Preview Tool Log Options.